See [1].
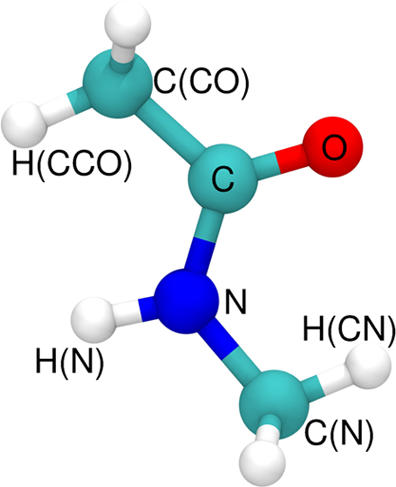
Nonequilibrium molecular dynamics (MD) simulations together with physics-based force fields are used to follow energy flow between vibrationally excited N-methylacetamide (NMA) and water. The simulations were carried out with a previously validated force field for NMA, based on a multipolar representation of the electrostatics, and with a new fluctuating point charge model. For the water solvent, a flexible and a rigid model was employed to distinguish between the role of inter- and intramolecular degrees of freedom.
On a 10 ps time scale about 90% of the available energy goes into the solvent. The remaining energy resides within internal NMA-degrees of freedom from where energy flow takes place on longer time scales. The total amount of energy transferred to the solvent on the 10 ps time scale does not depend on whether the water molecules are rigid or flexible during the simulations.

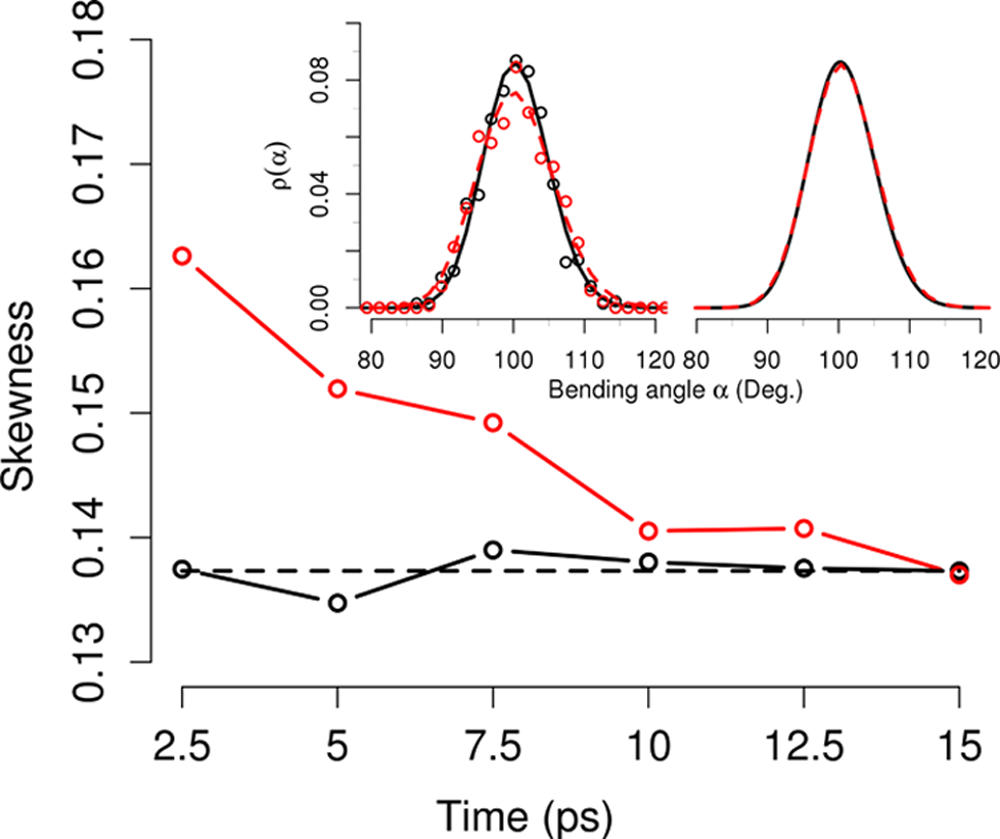
Vibrational energy relaxation time scales include two regimes: one on the several 100 fs time scale and a longer one, ranging from 6 to 10 ps. This longer time scale agrees with previous simulations but overestimates the experimentally determined relaxation time by a factor of 2, which can be explained by the classical treatment of the vibrations. Including a previously determined quantum correction factor brings the long time scale into quite favorable agreement with experiment. Coupling to the bending vibration of the water molecules in H-bonding contact with the excited C═O chromophore is substantial.
The equilibrium and nonequilibrium distribution of the bending angles of the water molecules in contact with the local oscillator are non-Gaussian, and one approaches the other on the subpicosecond time scale. Analysis of the water velocity distribution suggests that the C═O vibrational energy relaxes into the solvent water shells in an impulsive fashion on a picosecond time scale.
[1] P-A Cazade, F Hédin, Z-H Xu, and M Meuwly, J. Phys. Chem. B, 2015